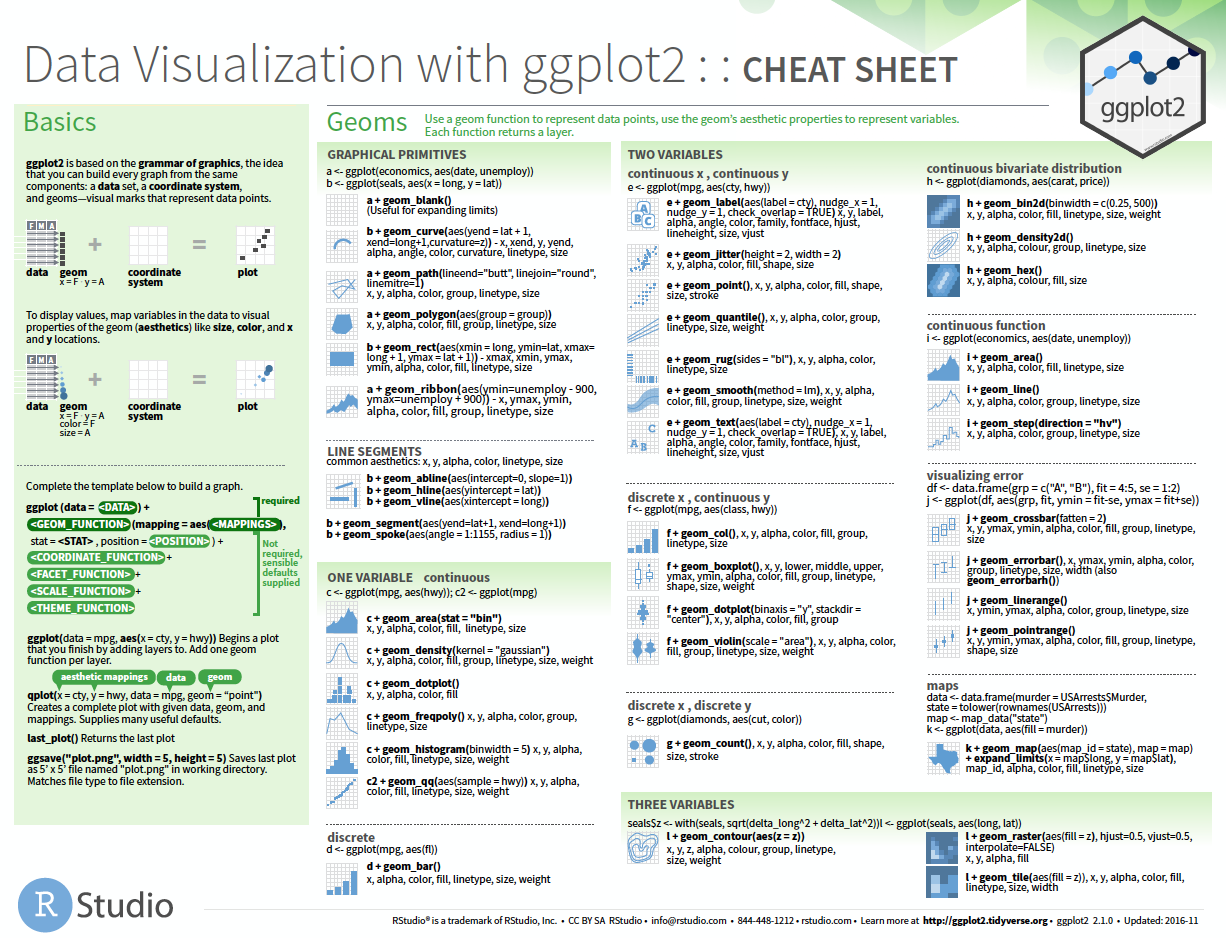
Data visualisation with
Presented by Emi Tanaka
School of Mathematics and Statistics
dr.emi.tanaka@gmail.com
@statsgen
1st Dec 2019 @ Biometrics by the Botanic Gardens | Adelaide, Australia
🎯 Aim: draw beautiful plots like this using (layered) grammar of graphics
Basic structure of ggplot: 3 🔑 components

- data,
- a set of aesthetic mappings between variables in the data and visual properties, and
- at least one layer which describes how to render each observation.
🗃 Data: Classic iris dataset
iris is a built-in dataset in R - type iris to your console and press Enter.
skimr::skim(iris) Skim summary statistics n obs: 150 n variables: 5 ── Variable type:factor ───────────────────────────────────────── variable missing complete n n_unique top_counts ordered Species 0 150 150 3 set: 50, ver: 50, vir: 50, NA: 0 FALSE ── Variable type:numeric ──────────────────────────────────────── variable missing complete n mean sd p0 p25 p50 p75 p100 hist Petal.Length 0 150 150 3.76 1.77 1 1.6 4.35 5.1 6.9 ▇▁▁▂▅▅▃▁ Petal.Width 0 150 150 1.2 0.76 0.1 0.3 1.3 1.8 2.5 ▇▁▁▅▃▃▂▂ Sepal.Length 0 150 150 5.84 0.83 4.3 5.1 5.8 6.4 7.9 ▂▇▅▇▆▅▂▂ Sepal.Width 0 150 150 3.06 0.44 2 2.8 3 3.3 4.4 ▁▂▅▇▃▂▁▁
Aesthestic mappings: aethestic = column

Sepal.Lengthis mapped to thexcoordinateSepal.Widthis mapped to theycoordinateSpeciesis mapped to thecolor
Layer
Each layer has a
geom- the geometric object to use display the data,stat- statisitcal transformations to use on the data,dataandmappingwhich is usually inherited fromggplotobject,
Further specifications are provided by position adjustment, show_legend and so on.
Hidden argument names in ggplot

ggplot(iris, aes(Species))ggplot(iris, aes(Species, Sepal.Length))- No need to write explicitly write out
data =,mapping =,x =, andy =each time inggplot. ggplotcode in the wild often omit these argument names.- But position needs to be correct if argument name not specified!
- If no layer is specified, then plot is
geom_blank().
Example layer: geom_point()
The <layer> is usually created by a function preceded by geom_ in its name.
ggplot(iris, aes(Species, Sepal.Length)) + geom_point()
is a shorthand for
ggplot(iris, aes(Species, Sepal.Length)) + layer(geom = "point", stat = "identity", position = "identity", params = list(na.rm = FALSE))Different geometric objects
p <- ggplot(iris, aes(Species, Sepal.Length))p + geom_violin()p + geom_boxplot()p + geom_point()geom
| geom | Description |
|---|---|
| geom_abline, geom_hline, geom_vline | Reference lines: horizontal, vertical, and diagonal |
| geom_bar, geom_col | Bar charts |
| geom_bin2d | Heatmap of 2d bin counts |
| geom_blank | Draw nothing |
| geom_boxplot | A box and whiskers plot (in the style of Tukey) |
| geom_contour | 2d contours of a 3d surface |
| geom_count | Count overlapping points |
| geom_density | Smoothed density estimates |
| geom_density_2d, geom_density2d | Contours of a 2d density estimate |
| geom_dotplot | Dot plot |
Statistical transformation
g <- ggplot(iris, aes(Species, Sepal.Length)) + geom_boxplot()- The
y-axis is not the raw data! - It is plotting a statistical transformation of the
y-values. - Under the hood, data is transformed (including
xfactor input to numerical values).
layer_data(g, 1) ymin lower middle upper ymax outliers notchupper notchlower x PANEL group ymin_final ymax_final xmin xmax xid newx new_width weight colour fill size alpha shape linetype 1 4.3 4.800 5.0 5.2 5.8 5.089378 4.910622 1 1 1 4.3 5.8 0.625 1.375 1 1 0.75 1 grey20 white 0.5 NA 19 solid 2 4.9 5.600 5.9 6.3 7.0 6.056412 5.743588 2 1 2 4.9 7.0 1.625 2.375 2 2 0.75 1 grey20 white 0.5 NA 19 solid 3 5.6 6.225 6.5 6.9 7.9 4.9 6.650826 6.349174 3 1 3 4.9 7.9 2.625 3.375 3 3 0.75 1 grey20 white 0.5 NA 19 solidStatistical transformation: stat_bin
- For
geom_histogram, default isstat = "bin". - For
stat_bin, default isgeom = "bar". - Every
geomhas astatand vice versa.
p <- ggplot(iris, aes(Sepal.Length))p + geom_histogram()p + stat_bin(geom = "bar")p + stat_bin(geom = "line")Using statistical transformations
To map an aesthestic to computed statistical variable (say called var), you can refer to it by either stat(var) or ..var...
stat = "bin"
x count density 1 4.344828 4 0.2148148 2 4.468966 1 0.0537037 3 4.593103 4 0.2148148 4 4.717241 2 0.1074074 5 4.841379 11 0.5907407 6 4.965517 10 0.5370370 7 5.089655 9 0.4833333 8 5.213793 4 0.2148148 9 5.337931 7 0.3759259 10 5.462069 7 0.3759259 11 5.586207 6 0.3222222 12 5.710345 8 0.4296296 13 5.834483 7 0.3759259 14 5.958621 9 0.4833333 15 6.082759 6 0.3222222 16 6.206897 4 0.2148148 17 6.331034 9 0.4833333 18 6.455172 12 0.6444444 19 6.579310 2 0.1074074 20 6.703448 8 0.4296296 21 6.827586 3 0.1611111 22 6.951724 5 0.2685185 23 7.075862 1 0.0537037 24 7.200000 3 0.1611111 25 7.324138 1 0.0537037 26 7.448276 1 0.0537037 27 7.572414 1 0.0537037 28 7.696552 4 0.2148148 29 7.820690 0 0.0000000 30 7.944828 1 0.0537037p + geom_histogram(aes(y = stat(density) ))p + geom_histogram(aes(y = ..density.. ))stat
| stat | Description |
|---|---|
| stat_count | Bar charts |
| stat_bin_2d, stat_bin2d | Heatmap of 2d bin counts |
| stat_boxplot | A box and whiskers plot (in the style of Tukey) |
| stat_contour | 2d contours of a 3d surface |
| stat_sum | Count overlapping points |
| stat_density | Smoothed density estimates |
| stat_density_2d, stat_density2d | Contours of a 2d density estimate |
| stat_bin_hex, stat_binhex | Hexagonal heatmap of 2d bin counts |
| stat_bin | Histograms and frequency polygons |
| stat_qq_line, stat_qq | A quantile-quantile plot |
Add multiple layers
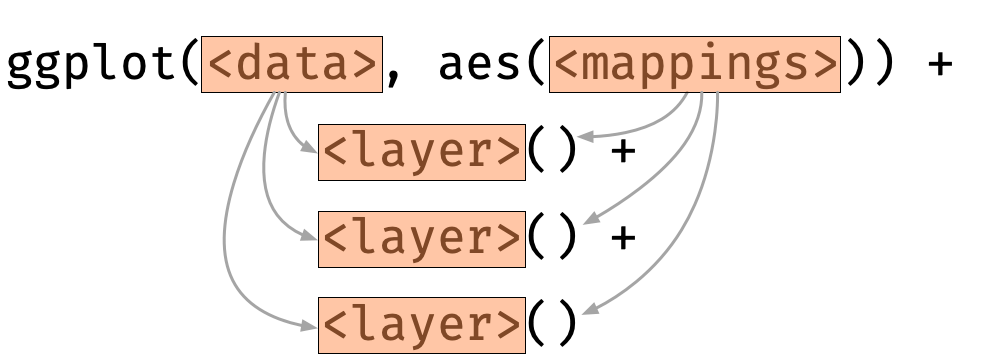
Each layer inherits mapping and data from ggplot by default.
ggplot(data = iris, aes(x = Species, y = Sepal.Length)) + geom_violin() + geom_boxplot() + geom_point()Order of the layers matters!
Boxplot and violin plot order are switched around.
ggplot(data = iris, aes(x = Species, y = Sepal.Length)) + geom_violin() + geom_boxplot() + geom_point()ggplot(data = iris, aes(x = Species, y = Sepal.Length)) + geom_boxplot() + geom_violin() + geom_point()Layer-specific data and aesthestic mappings

For each layer, aesthestic and/or data can be overwritten.
ggplot(iris, aes(Species, Sepal.Length)) + geom_violin(aes(fill = Species)) + geom_boxplot(data = filter(iris, Species=="setosa")) + geom_point(data = filter(iris, Species=="setosa"), aes(y = Sepal.Width))Facetting
g <- ggplot(iris, aes(Sepal.Length, Sepal.Width, color = Species)) + geom_point()gg + facet_wrap(~Species)g + facet_grid(cut(Petal.Length, 3) ~ Species)HELP!
- RStudio > Help > Cheatsheets
- R4DS Community Slack
- Twitter with hastag #rstats
- RStudio Community
- Stackoverflow
Recreate-the-plot Game
colnames(iris) [1] "Sepal.Length" "Sepal.Width" "Petal.Length" "Petal.Width" "Species"What are the mappings and geoms?
x = ?y = ?color = ?fill = ?geom_???- other ?
Open and go through:
challenge-01-recreate-ggplot.Rmd
For answers go to (but don't look until trying!):
challenge-01-recreate-ggplot-solution.Rmd
20:00
Scales
Diamonds data
skimr::skim(diamonds) Skim summary statistics n obs: 53940 n variables: 10 ── Variable type:factor ───────────────────────────────────────── variable missing complete n n_unique top_counts ordered clarity 0 53940 53940 8 SI1: 13065, VS2: 12258, SI2: 9194, VS1: 8171 TRUE color 0 53940 53940 7 G: 11292, E: 9797, F: 9542, H: 8304 TRUE cut 0 53940 53940 5 Ide: 21551, Pre: 13791, Ver: 12082, Goo: 4906 TRUE ── Variable type:integer ──────────────────────────────────────── variable missing complete n mean sd p0 p25 p50 p75 p100 hist price 0 53940 53940 3932.8 3989.44 326 950 2401 5324.25 18823 ▇▃▂▁▁▁▁▁ ── Variable type:numeric ──────────────────────────────────────── variable missing complete n mean sd p0 p25 p50 p75 p100 hist carat 0 53940 53940 0.8 0.47 0.2 0.4 0.7 1.04 5.01 ▇▅▁▁▁▁▁▁ depth 0 53940 53940 61.75 1.43 43 61 61.8 62.5 79 ▁▁▁▃▇▁▁▁ table 0 53940 53940 57.46 2.23 43 56 57 59 95 ▁▅▇▁▁▁▁▁ x 0 53940 53940 5.73 1.12 0 4.71 5.7 6.54 10.74 ▁▁▁▇▇▃▁▁ y 0 53940 53940 5.73 1.14 0 4.72 5.71 6.54 58.9 ▇▁▁▁▁▁▁▁ z 0 53940 53940 3.54 0.71 0 2.91 3.53 4.04 31.8 ▇▃▁▁▁▁▁▁💎
Scales
- Scales control the mapping from data to aesthetics.

g <- ggplot(diamonds, aes(carat, price) ) + geom_hex()g + scale_y_continuous() + scale_x_continuous()g + scale_x_reverse() + scale_y_continuous(trans="log10")g + scale_y_log10() + scale_x_sqrt()scale
| scales | Description |
|---|---|
| scale_alpha, scale_alpha_continuous, scale_alpha_discrete, scale_alpha_ordinal, scale_alpha_datetime, scale_alpha_date | Alpha transparency scales |
| scale_colour_brewer, scale_fill_brewer, scale_colour_distiller, scale_fill_distiller, scale_color_brewer, scale_color_distiller | Sequential, diverging and qualitative colour scales from colorbrewer.org |
| scale_colour_continuous, scale_fill_continuous | Continuous colour scales |
| scale_x_continuous, scale_y_continuous, scale_x_log10, scale_y_log10, scale_x_reverse, scale_y_reverse, scale_x_sqrt, scale_y_sqrt | Position scales for continuous data (x & y) |
Guide: an axis or a legend
- The scale creates a guide: an axis or legend.
- So to modify these you generally use
scale_*or other handy functions (guides,labs,xlab,ylaband so on).
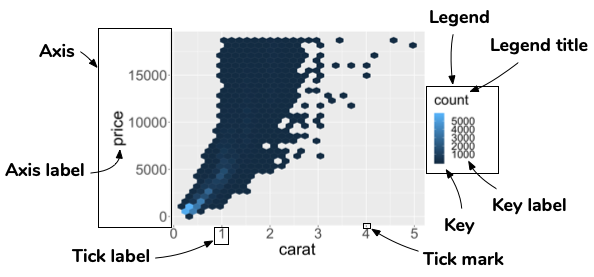
Modify axis
g + scale_y_continuous(name = "Price", breaks = c(0, 10000), labels = c("0", "More\n than\n 10K")) + geom_hline(yintercept = 10000, color = "red", size = 2)Nicer formatting functions in scales 📦
g + scale_y_continuous( label = scales::dollar_format() )Modifying legend
g + scale_fill_continuous( breaks = c(0, 10, 100, 1000, 4000), trans = "log10" )Removing legend
g + scale_fill_continuous( guide = "none" )Alternative control of guides
g + ylab("Price") + # Changes the y axis label labs(x = "Carat", # Changes the x axis label fill = "Count") # Changes the legend nameg + guides(fill = "none") # remove the legendOpen and go through:
challenge-02-ggplot-scales.Rmd
For answers go to (but again don't look until trying!):
challenge-02-ggplot-scales-solution.Rmd
15:00
Themes
How to change the look?
theme: modify the look of texts
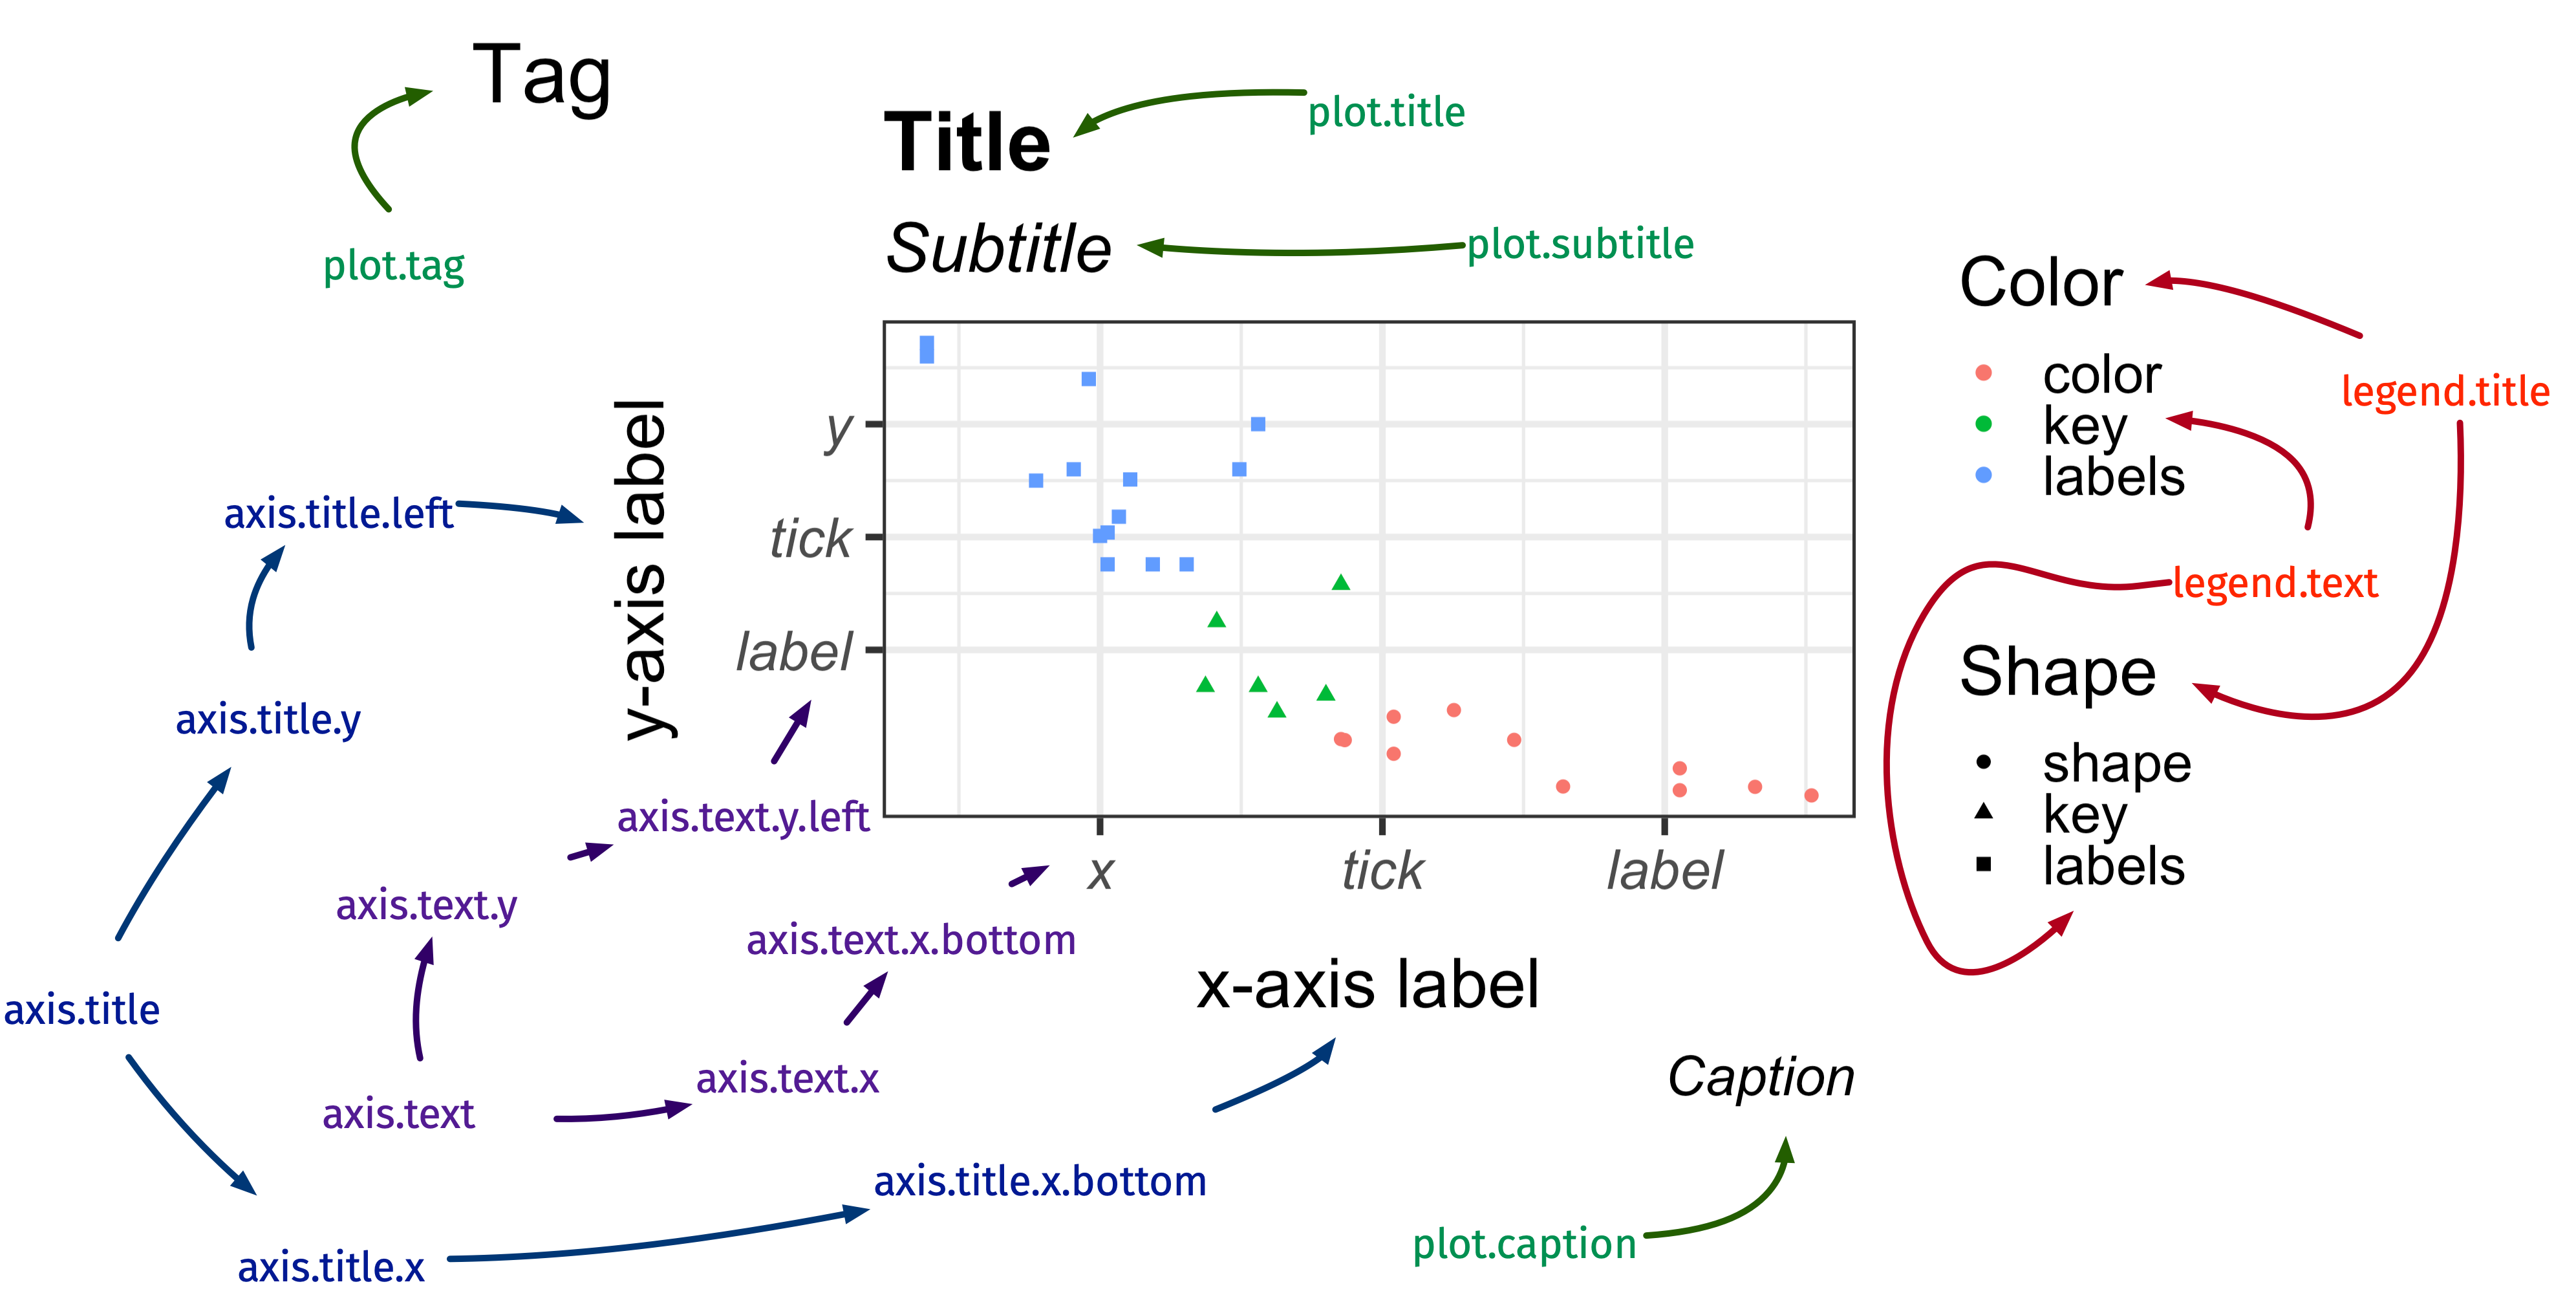
element_text()
element_text()
ggplot(diamonds, aes(carat, price)) + geom_hex() + labs(title = "Diamond") + theme(axis.title.x = element_text(size = 30, color = "red", face = "bold", angle = 10, family = "Fira Code"), legend.title = element_text(size = 25, color = "#ef42eb", margin = margin(b = 5)), plot.title = element_text(size = 35, face = "bold", family = "Nunito", color = "blue" ))theme: modify the look of the lines
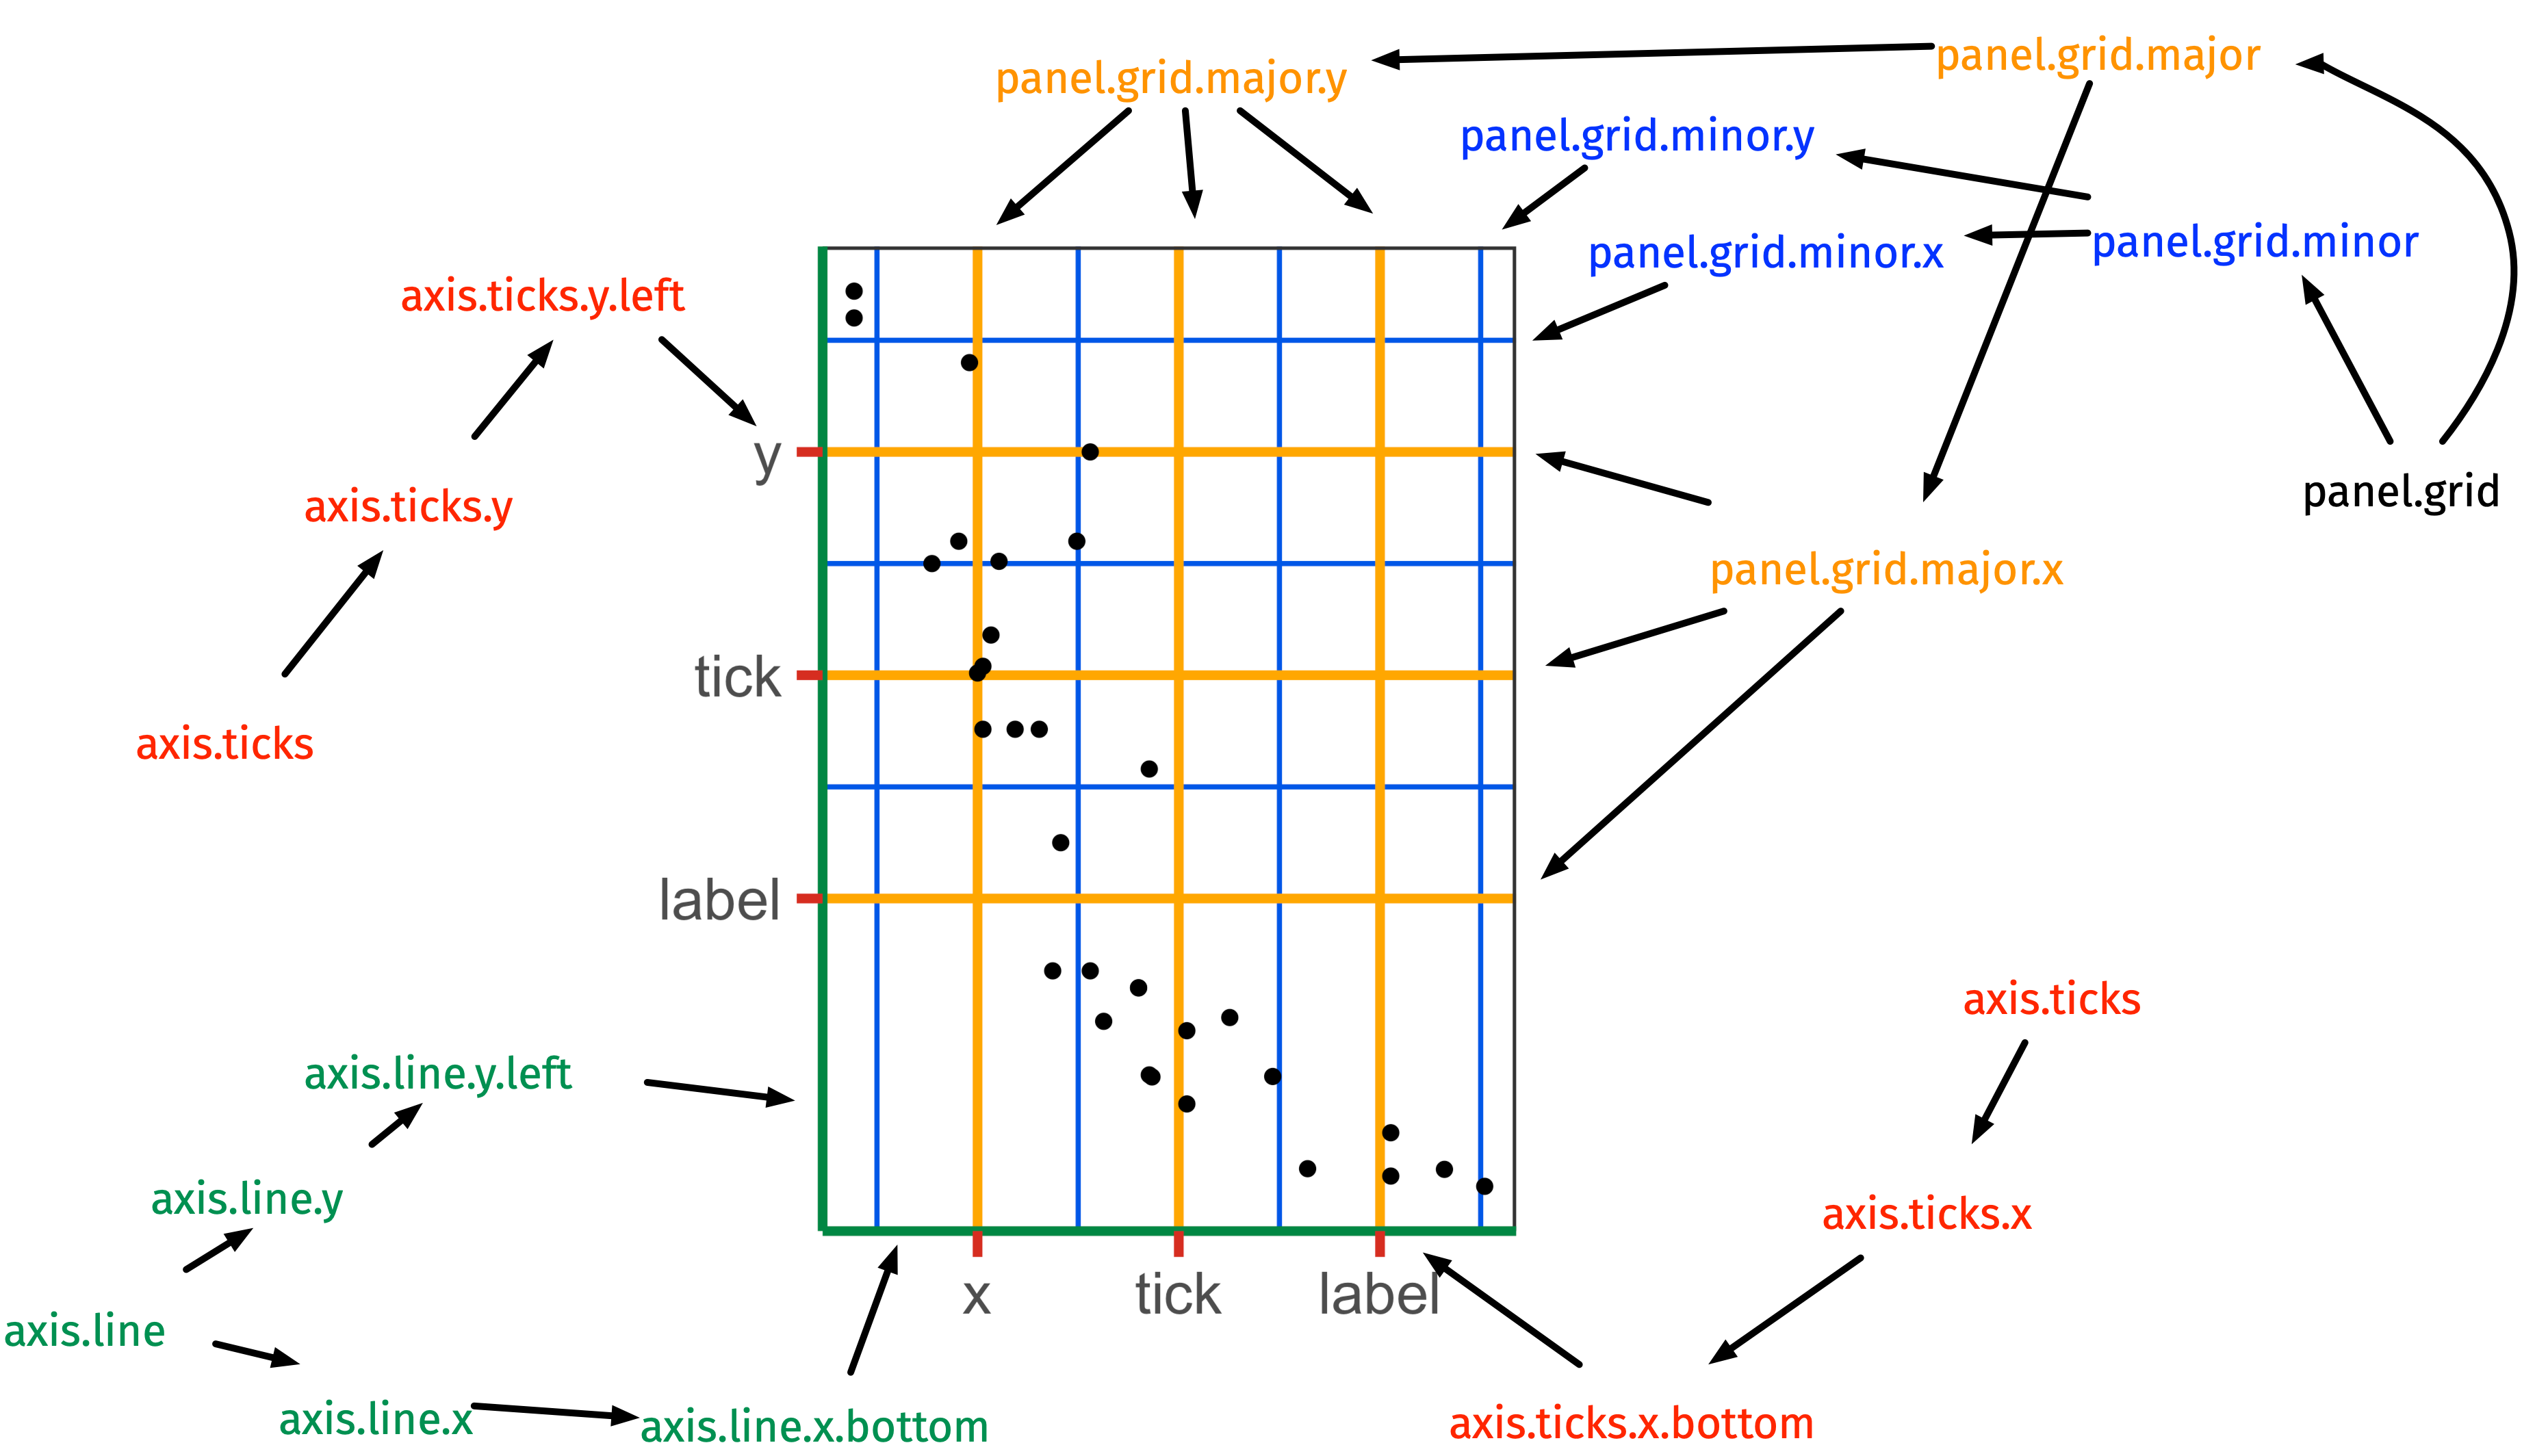
element_line()
element_line()
ggplot(iris, aes(Sepal.Length, Sepal.Width)) + geom_point() + theme(axis.line.y = element_line(color = "black", size = 1.2, arrow = grid::arrow()), axis.line.x = element_line(linetype = "dashed", color = "brown", size = 1.2), axis.ticks = element_line(color = "red", size = 1.1), axis.ticks.length = unit(3, "mm"), panel.grid.major = element_line(color = "blue", size = 1.2), panel.grid.minor = element_line(color = "#0080ff", size = 1.2, linetype = "dotted"))theme: modify the look of the
rectangular regions
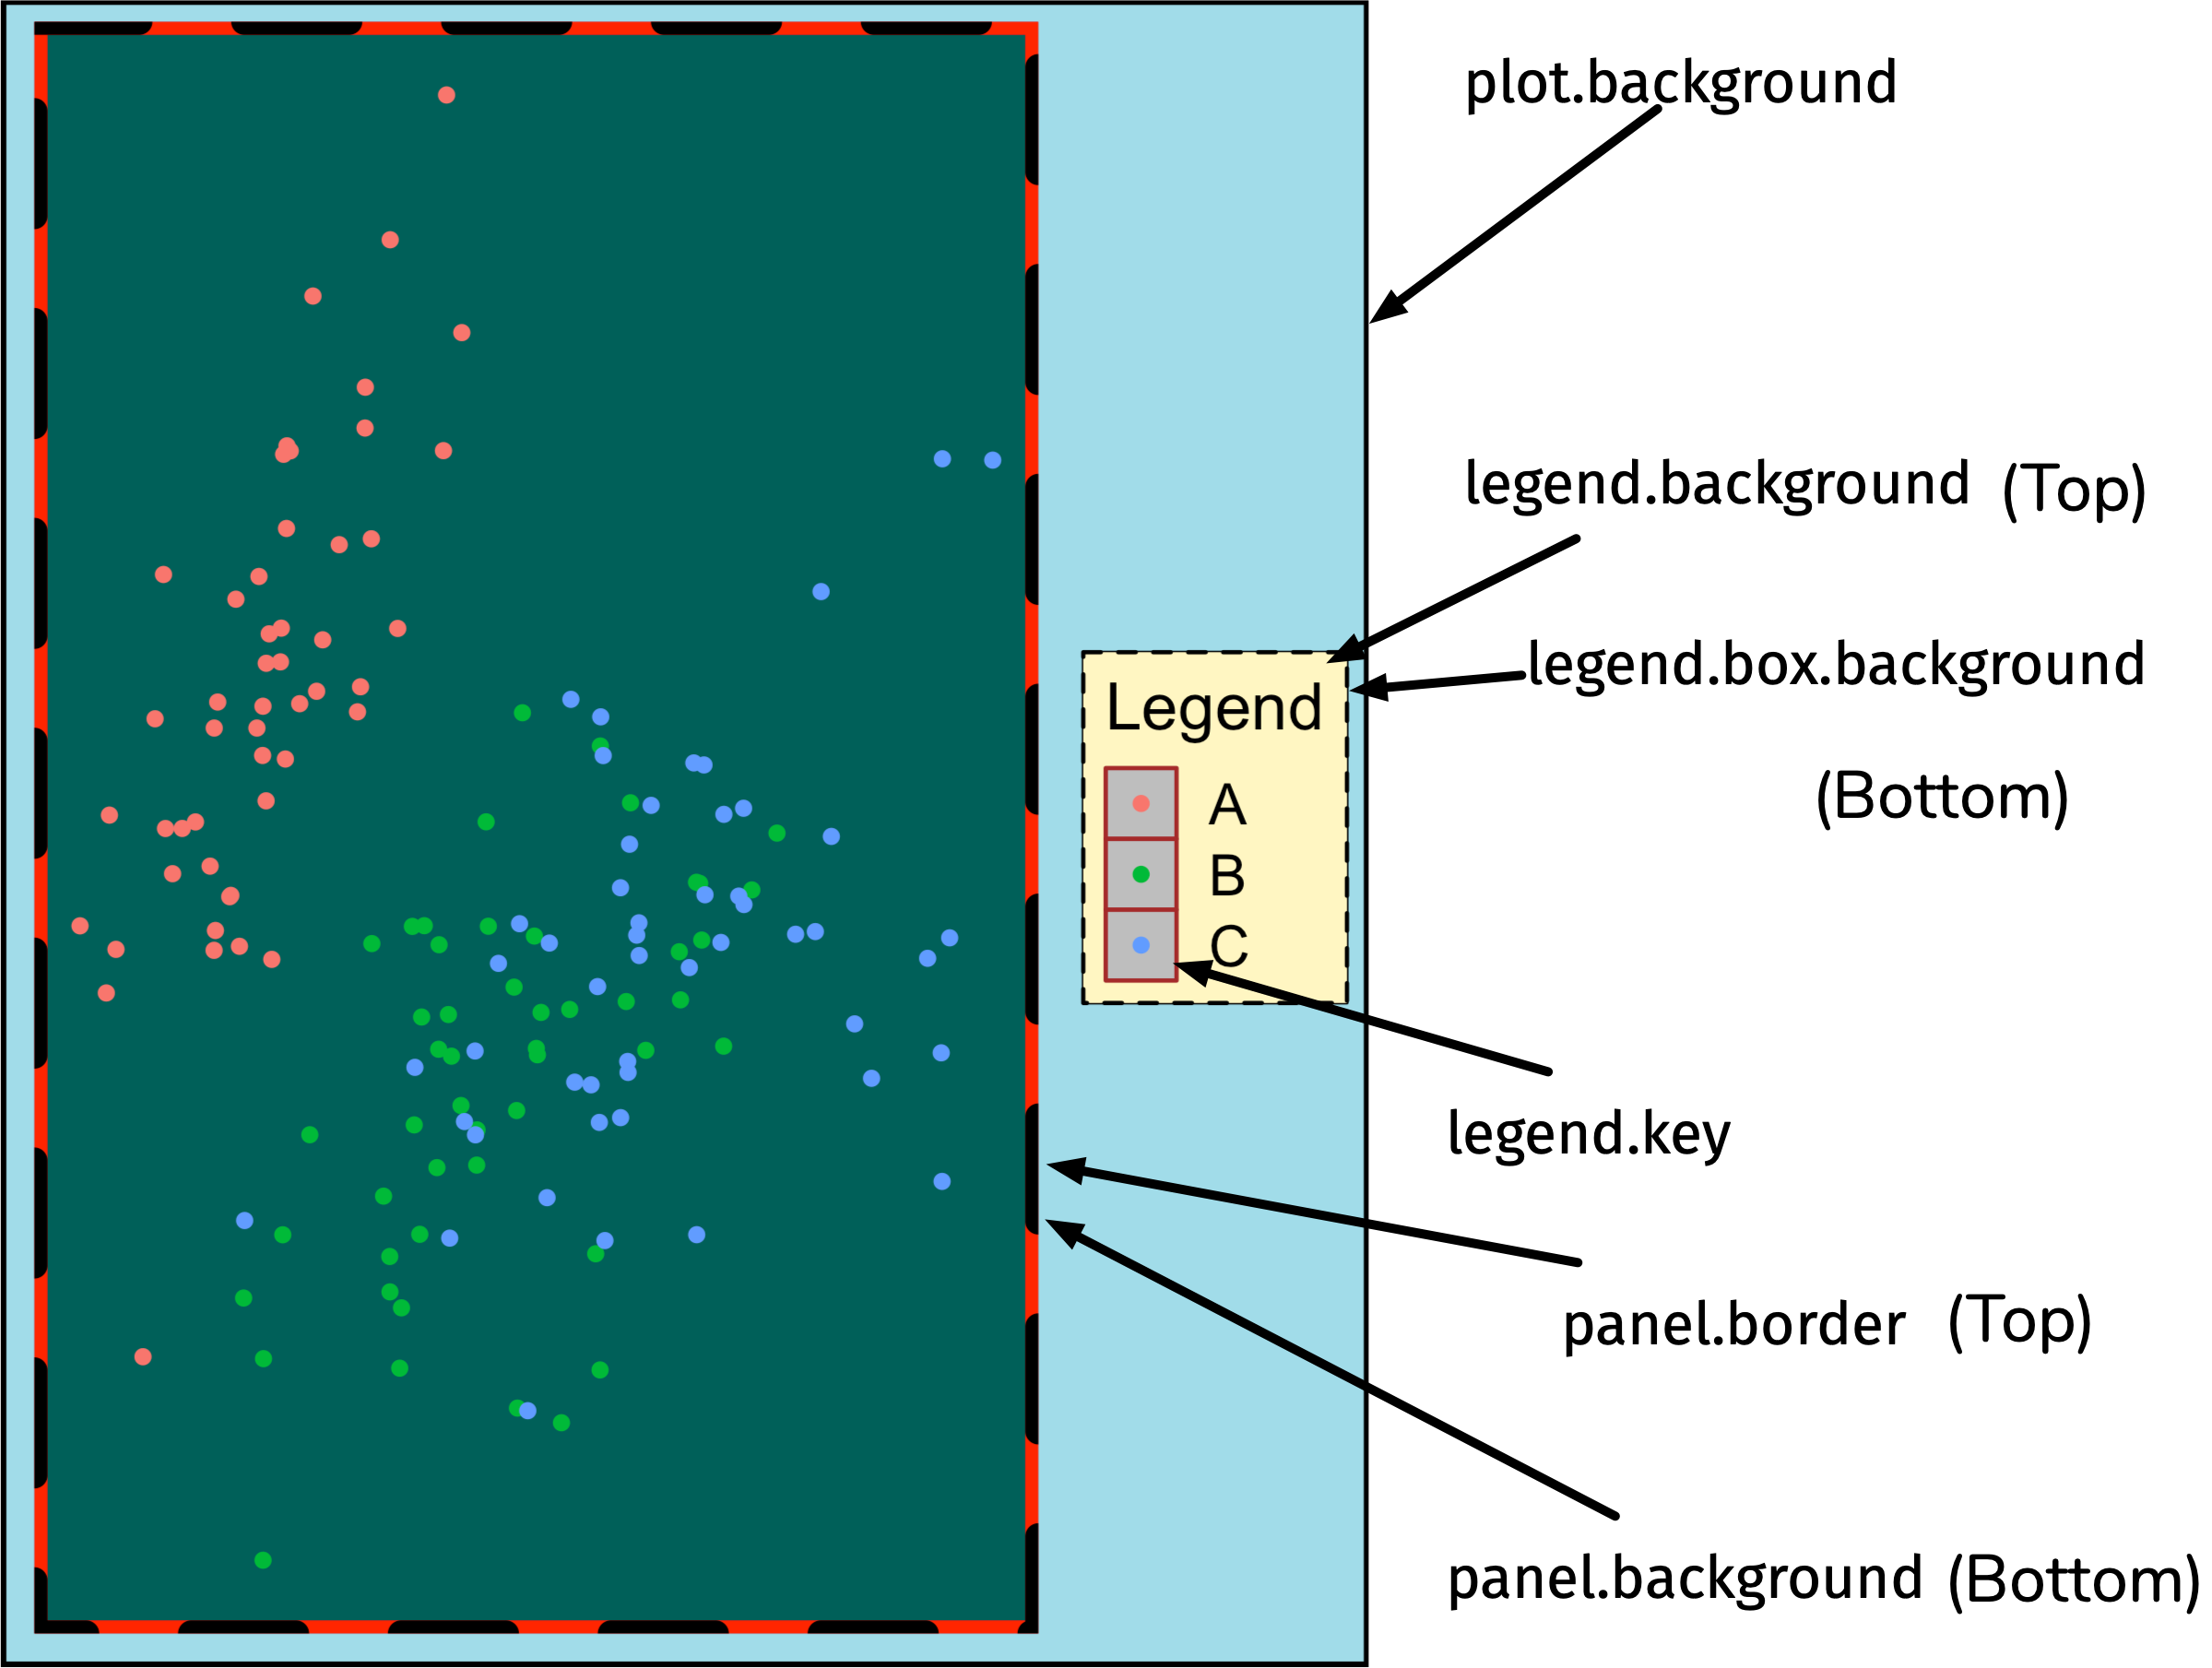
element_rect()
element_line()
ggplot(iris, aes(Sepal.Length, Sepal.Width)) + geom_point(aes(color = Species)) + theme( legend.background = element_rect(fill = "#fff6c2", color = "black", linetype = "dashed"), legend.key = element_rect(fill = "grey", color = "brown"), panel.background = element_rect(fill = "#005F59", color = "red", size = 3), panel.border = element_rect(color = "black", fill = "transparent", linetype = "dashed", size = 3), plot.background = element_rect(fill = "#a1dce9", color = "black", size = 1.3), legend.position = "bottom")Open and go through:
challenge-03-ggplot-themes.Rmd
For answers go to:
challenge-03-ggplot-themes-solution.Rmd
Session Information
devtools::session_info() ─ Session info ─────────────────────────────────────────────────────────────────────────────────────────────────────────────────────────────────────────────────────────────────────────────────────────────────────────────────────────────────────────────────────────────────────────────────────────────────────────────────────────────────────────────────────────────────────────────────────────────────────────────────────────────────────────────────────────────────────────────────────────────────────────────────────────────────────────────────────────────────────────────────────────────────────────────────────────────────────────────────────────────────────────────────────────────────────────────────────────────────────────────────────────────────────────────────────────────────────────────────────────────────────────────────────────────────────────────────────────────────────────────────────────────────────────────────────────────────────────────────────────────────────────────────────── setting value version R version 3.6.0 (2019-04-26) os macOS Mojave 10.14.6 system x86_64, darwin15.6.0 ui X11 language (EN) collate en_AU.UTF-8 ctype en_AU.UTF-8 tz Australia/Adelaide date 2019-12-03 ─ Packages ─────────────────────────────────────────────────────────────────────────────────────────────────────────────────────────────────────────────────────────────────────────────────────────────────────────────────────────────────────────────────────────────────────────────────────────────────────────────────────────────────────────────────────────────────────────────────────────────────────────────────────────────────────────────────────────────────────────────────────────────────────────────────────────────────────────────────────────────────────────────────────────────────────────────────────────────────────────────────────────────────────────────────────────────────────────────────────────────────────────────────────────────────────────────────────────────────────────────────────────────────────────────────────────────────────────────────────────────────────────────────────────────────────────────────────────────────────────────────────────────────────────────────────────── package * version date lib source anicon 0.1.0 2019-05-28 [1] Github (emitanaka/anicon@377aece) assertthat 0.2.1 2019-03-21 [1] CRAN (R 3.6.0) backports 1.1.4 2019-04-10 [1] CRAN (R 3.6.0) broom 0.5.2 2019-04-07 [1] CRAN (R 3.6.0) callr 3.3.1 2019-07-18 [1] CRAN (R 3.6.0) cellranger 1.1.0 2016-07-27 [1] CRAN (R 3.6.0) cli 1.1.0 2019-03-19 [1] CRAN (R 3.6.0) colorspace 1.4-1 2019-03-18 [1] CRAN (R 3.6.0) countdown 0.2.0 2019-05-30 [1] Github (gadenbuie/countdown@c8e8710) crayon 1.3.4 2017-09-16 [1] CRAN (R 3.6.0) crosstalk 1.0.0 2016-12-21 [1] CRAN (R 3.6.0) desc 1.2.0 2018-05-01 [1] CRAN (R 3.6.0) devtools 2.0.2 2019-04-08 [1] CRAN (R 3.6.0) digest 0.6.22 2019-10-21 [1] CRAN (R 3.6.0) dplyr * 0.8.3 2019-07-04 [1] CRAN (R 3.6.0) DT 0.6 2019-05-09 [1] CRAN (R 3.6.0) ellipsis 0.2.0.9000 2019-08-03 [1] Github (r-lib/ellipsis@27e0846) emo 0.0.0.9000 2019-06-03 [1] Github (hadley/emo@02a5206) evaluate 0.14 2019-05-28 [1] CRAN (R 3.6.0) forcats * 0.4.0 2019-02-17 [1] CRAN (R 3.6.0) fs 1.3.1 2019-05-06 [1] CRAN (R 3.6.0) generics 0.0.2 2018-11-29 [1] CRAN (R 3.6.0) ggplot2 * 3.2.1 2019-08-10 [1] CRAN (R 3.6.0) glue 1.3.1.9000 2019-10-24 [1] Github (tidyverse/glue@71eeddf) gtable 0.3.0 2019-03-25 [1] CRAN (R 3.6.0) haven 2.1.0 2019-02-19 [1] CRAN (R 3.6.0) here 0.1 2017-05-28 [1] CRAN (R 3.6.0) hexbin 1.27.3 2019-05-14 [1] CRAN (R 3.6.0) hms 0.5.1 2019-08-23 [1] CRAN (R 3.6.0) htmltools 0.4.0 2019-10-04 [1] CRAN (R 3.6.0) htmlwidgets 1.3 2018-09-30 [1] CRAN (R 3.6.0) httpuv 1.5.2 2019-09-11 [1] CRAN (R 3.6.0) httr 1.4.1 2019-08-05 [1] CRAN (R 3.6.0) icon 0.1.0 2019-05-28 [1] Github (ropenscilabs/icon@a510f88) jsonlite 1.6 2018-12-07 [1] CRAN (R 3.6.0) knitr 1.25 2019-09-18 [1] CRAN (R 3.6.0) labeling 0.3 2014-08-23 [1] CRAN (R 3.6.0) later 1.0.0 2019-10-04 [1] CRAN (R 3.6.0) lattice 0.20-38 2018-11-04 [1] CRAN (R 3.6.0) lazyeval 0.2.2 2019-03-15 [1] CRAN (R 3.6.0) lifecycle 0.1.0 2019-08-01 [1] CRAN (R 3.6.0) lubridate 1.7.4 2018-04-11 [1] CRAN (R 3.6.0) magrittr 1.5 2014-11-22 [1] CRAN (R 3.6.0) memoise 1.1.0 2017-04-21 [1] CRAN (R 3.6.0) mime 0.7 2019-06-11 [1] CRAN (R 3.6.0) modelr 0.1.4 2019-02-18 [1] CRAN (R 3.6.0) munsell 0.5.0 2018-06-12 [1] CRAN (R 3.6.0) nlme 3.1-140 2019-05-12 [1] CRAN (R 3.6.0) pillar 1.4.2 2019-06-29 [1] CRAN (R 3.6.0) pkgbuild 1.0.3 2019-03-20 [1] CRAN (R 3.6.0) pkgconfig 2.0.3 2019-09-22 [1] CRAN (R 3.6.0) pkgload 1.0.2 2018-10-29 [1] CRAN (R 3.6.0) plyr 1.8.4 2016-06-08 [1] CRAN (R 3.6.0) png * 0.1-7 2013-12-03 [1] CRAN (R 3.6.0) prettyunits 1.0.2 2015-07-13 [1] CRAN (R 3.6.0) processx 3.4.1 2019-07-18 [1] CRAN (R 3.6.0) promises 1.1.0 2019-10-04 [1] CRAN (R 3.6.0) ps 1.3.0 2018-12-21 [1] CRAN (R 3.6.0) purrr * 0.3.2 2019-03-15 [1] CRAN (R 3.6.0) R6 2.4.0 2019-02-14 [1] CRAN (R 3.6.0) Rcpp 1.0.2 2019-07-25 [1] CRAN (R 3.6.0) readr * 1.3.1 2018-12-21 [1] CRAN (R 3.6.0) readxl 1.3.1 2019-03-13 [1] CRAN (R 3.6.0) remotes 2.0.4 2019-04-10 [1] CRAN (R 3.6.0) reshape2 1.4.3 2017-12-11 [1] CRAN (R 3.6.0) rlang 0.4.0.9000 2019-08-03 [1] Github (r-lib/rlang@b0905db) rmarkdown 1.16 2019-10-01 [1] CRAN (R 3.6.0) rprojroot 1.3-2 2018-01-03 [1] CRAN (R 3.6.0) rstudioapi 0.10 2019-03-19 [1] CRAN (R 3.6.0) rvest 0.3.4 2019-05-15 [1] CRAN (R 3.6.0) scales 1.0.0 2018-08-09 [1] CRAN (R 3.6.0) sessioninfo 1.1.1 2018-11-05 [1] CRAN (R 3.6.0) shiny 1.3.2 2019-04-22 [1] CRAN (R 3.6.0) skimr 1.0.6 2019-05-27 [1] CRAN (R 3.6.0) stringi 1.4.3 2019-03-12 [1] CRAN (R 3.6.0) stringr * 1.4.0 2019-02-10 [1] CRAN (R 3.6.0) testthat 2.2.1 2019-07-25 [1] CRAN (R 3.6.0) tibble * 2.1.3 2019-06-06 [1] CRAN (R 3.6.0) tidyr * 1.0.0 2019-09-11 [1] CRAN (R 3.6.0) tidyselect 0.2.5 2018-10-11 [1] CRAN (R 3.6.0) tidyverse * 1.2.1 2017-11-14 [1] CRAN (R 3.6.0) usethis 1.5.0 2019-04-07 [1] CRAN (R 3.6.0) vctrs 0.2.0.9000 2019-08-03 [1] Github (r-lib/vctrs@11c34ae) whisker 0.3-2 2013-04-28 [1] CRAN (R 3.6.0) withr 2.1.2 2018-03-15 [1] CRAN (R 3.6.0) xaringan 0.9 2019-03-06 [1] CRAN (R 3.6.0) xfun 0.10 2019-10-01 [1] CRAN (R 3.6.0) xml2 1.2.0 2018-01-24 [1] CRAN (R 3.6.0) xtable 1.8-4 2019-04-21 [1] CRAN (R 3.6.0) yaml 2.2.0 2018-07-25 [1] CRAN (R 3.6.0) zeallot 0.1.0 2018-01-28 [1] CRAN (R 3.6.0) [1] /Library/Frameworks/R.framework/Versions/3.6/Resources/libraryThese slides are licensed under

